

Investment Case: RIT Capital Partners PLC
A Family-Backed Capital Allocation Machine, Mispriced by Complexity?

Executive Summary
RIT Capital Partners sits in the Capital Allocators sleeve of The Tiny Family Office portfolio: This sleeve contains vehicles whose edge lies not in operating leverage but in long-term capital allocation across cycles. They deploy capital often better than I ever could.
Founded as the Rothschild family office and listed in 1988, RIT was designed to compound real wealth across generations.
Since inception, RIT has compounded NAV at an impressive rate of ~10.4% per annum. Over the last decade alone, NAV (not share price) has more than doubled. Yet today the shares trade at a ~25–30% discount to NAV, reflecting skepticism toward private assets, structural complexity, and the investment-trust format rather than underlying economics.
Recent evidence directly challenges that skepticism. Over the last ~18 months, RIT has realized roughly 25% of its private portfolio, with exits at or above carrying values, including notable realizations in AI and fintech. As of September 2025, NAV total return is ~10% year-to-date, with all three portfolio pillars contributing positively.
Management incentives are unusually well aligned: bonuses are capped, largely paid in shares with multi-year vesting, and subject to clawbacks. The Rothschild family remains a >20% shareholder, reinforcing generational stewardship.
At current prices, even conservative assumptions imply mid-single-digit returns; a partial narrowing of the discount lifts expected IRRs into the low-double-digit range.
Share Performance & The Tiny Family Office Portfolio
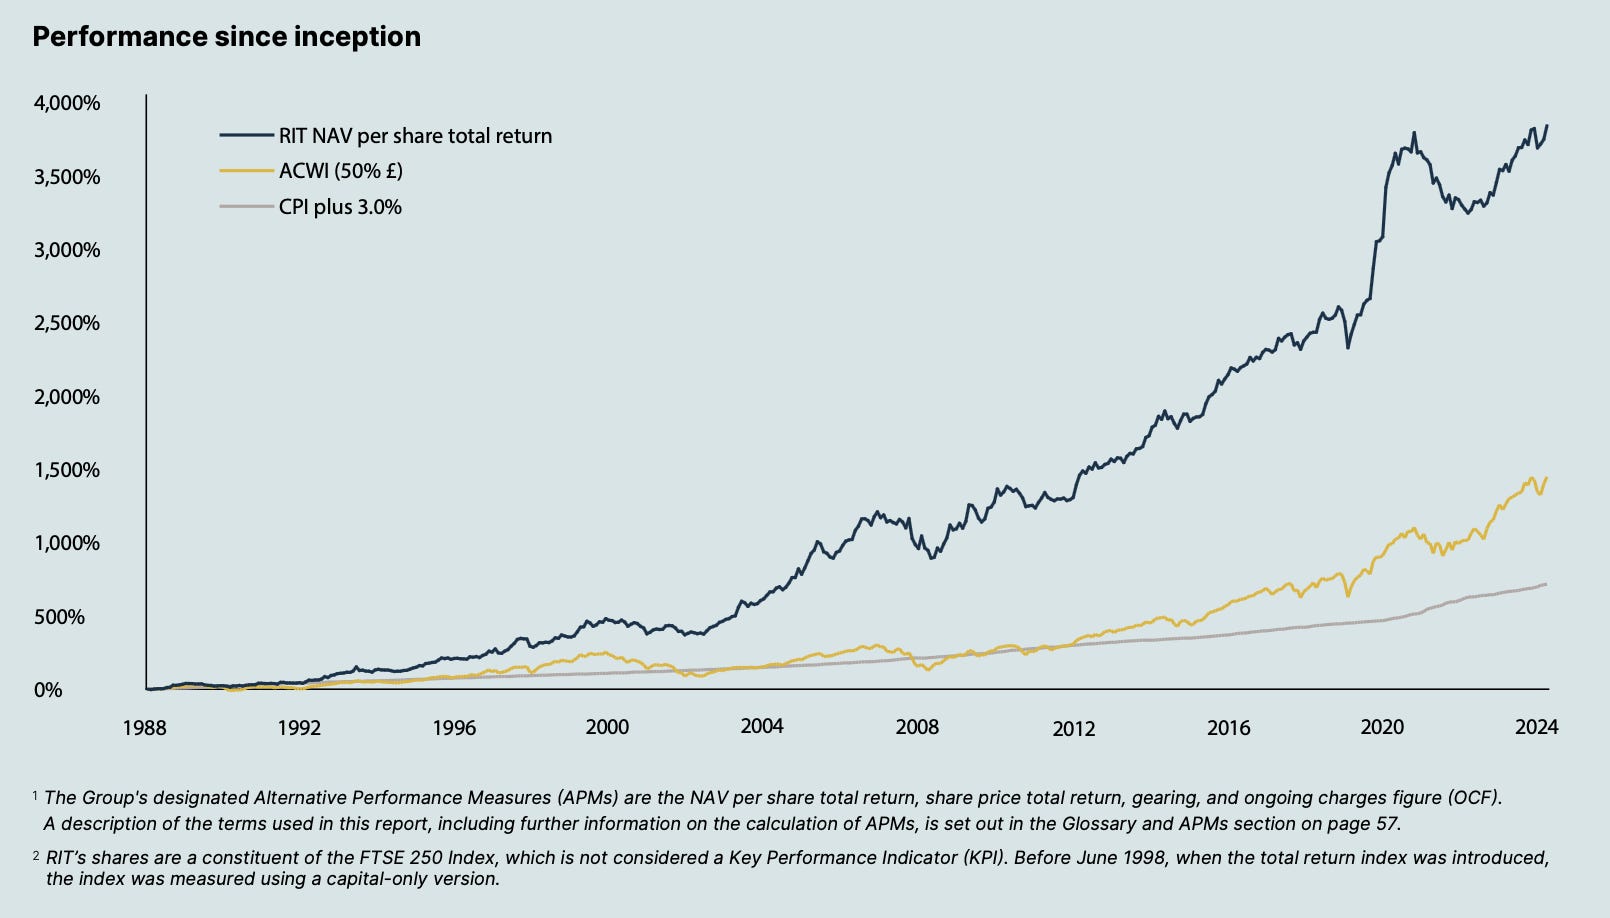
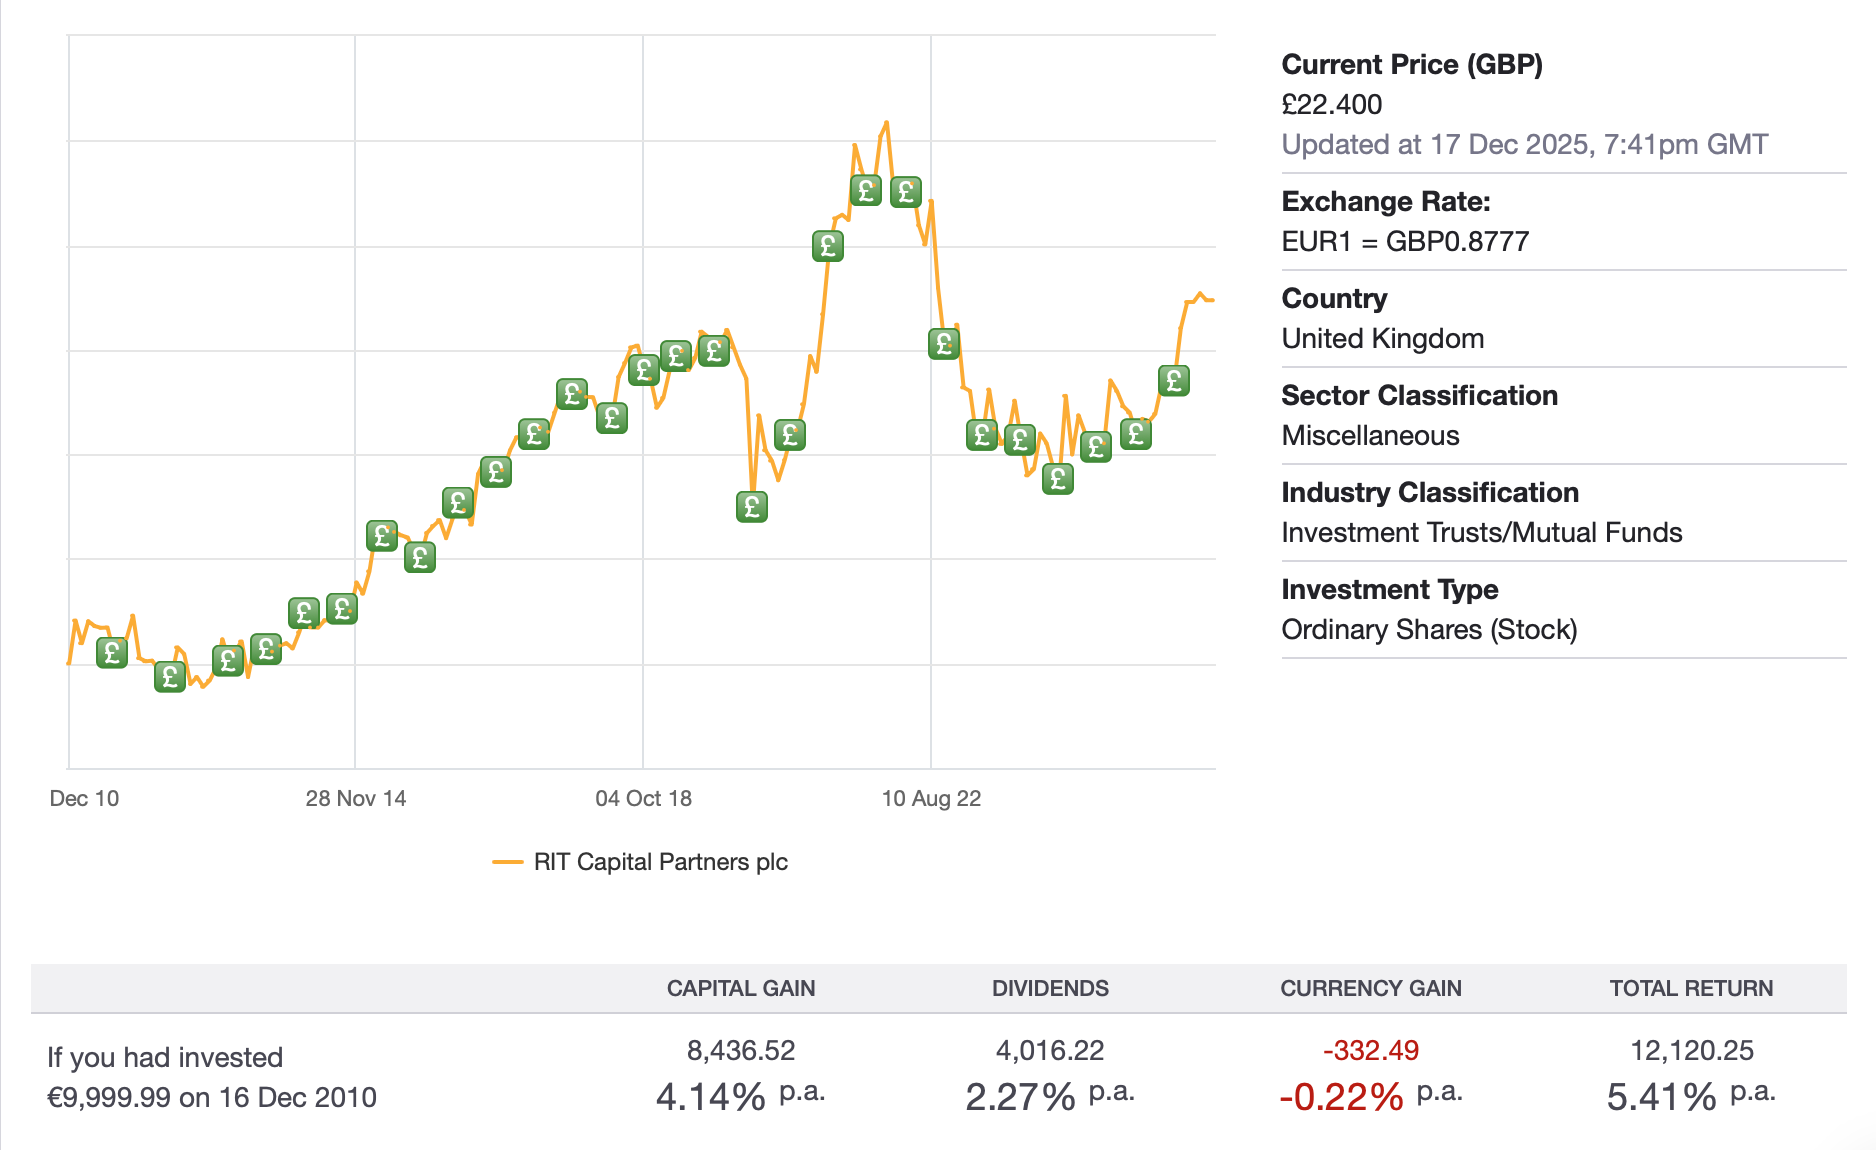
The performance of RIT must be viewed over decades and cycles. Taking just the last ten or twenty years (chart by Sharesight above) this certainly does not seem like a great investment, does it? It has underperformed the broad indices. Let’s see.
A portion of my portfolio is invested in Capital Allocators. This investment theme or portfolio sleeve exists for businesses whose primary skill is decision-making with capital.
There are a couple of good examples in Europe or the UK: RIT Capital, EXOR NV, Sofina SA, Investor AB. But also good capital allocators can be found in the U.S.. There is especially one: Berkshire Hathaway. Although Berkshire is an outlier because it is much more involved in actual operations of businesses.
Often these capital allocators have a family background which I like very much. They allocate capital across companies, geographies, and asset classes. They have access to investment vehicles and deals that I could never have as a private investor. In a crisis they are not hesitant to deploy capital or could even function as a lender of last resort (before the Fed) in the example of Berkshire Hathaway.
RIT fits naturally into my portfolio. It is neither a traditional equity fund nor a private-equity vehicle or a hedge fund. It is a permanent-capital allocator that combines all three, supported by a network built over decades and incentives designed for longevity. It is a publicly traded investment trust with permanent capital.
Portfolio & Performance Overview: Three Pillars, Three Behaviours
RIT’s portfolio is deliberately structured around three return engines, each designed to behave differently across market environments:
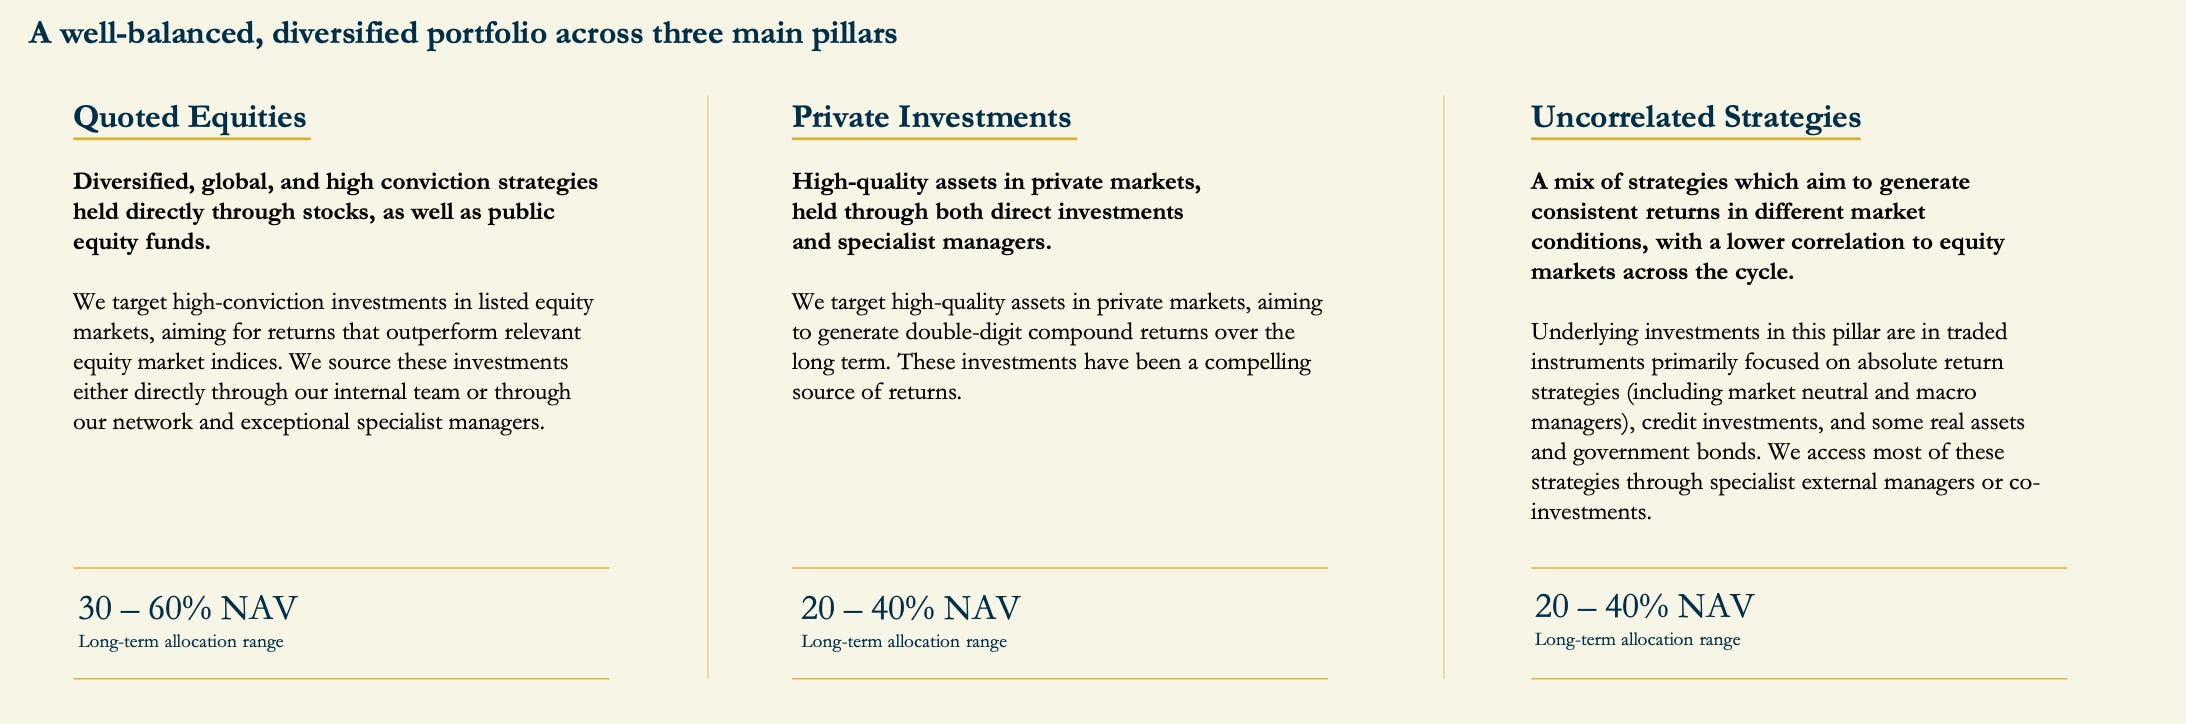
Quoted Equities: liquid, diversified, mark-to-market compounding through direct investments and fund managers
Private Investments: growth (important), and asymmetric upside
Uncorrelated Strategies: absolute return, hedge funds, credit funds working as a volatility dampener and capital stabiliser
The key insight: these pillars are not meant to outperform simultaneously. They are meant to coexist, allowing the trust to compound through regimes rather than chase cycles. This is very similar to how I built the portfolio of The Tiny Family Office.
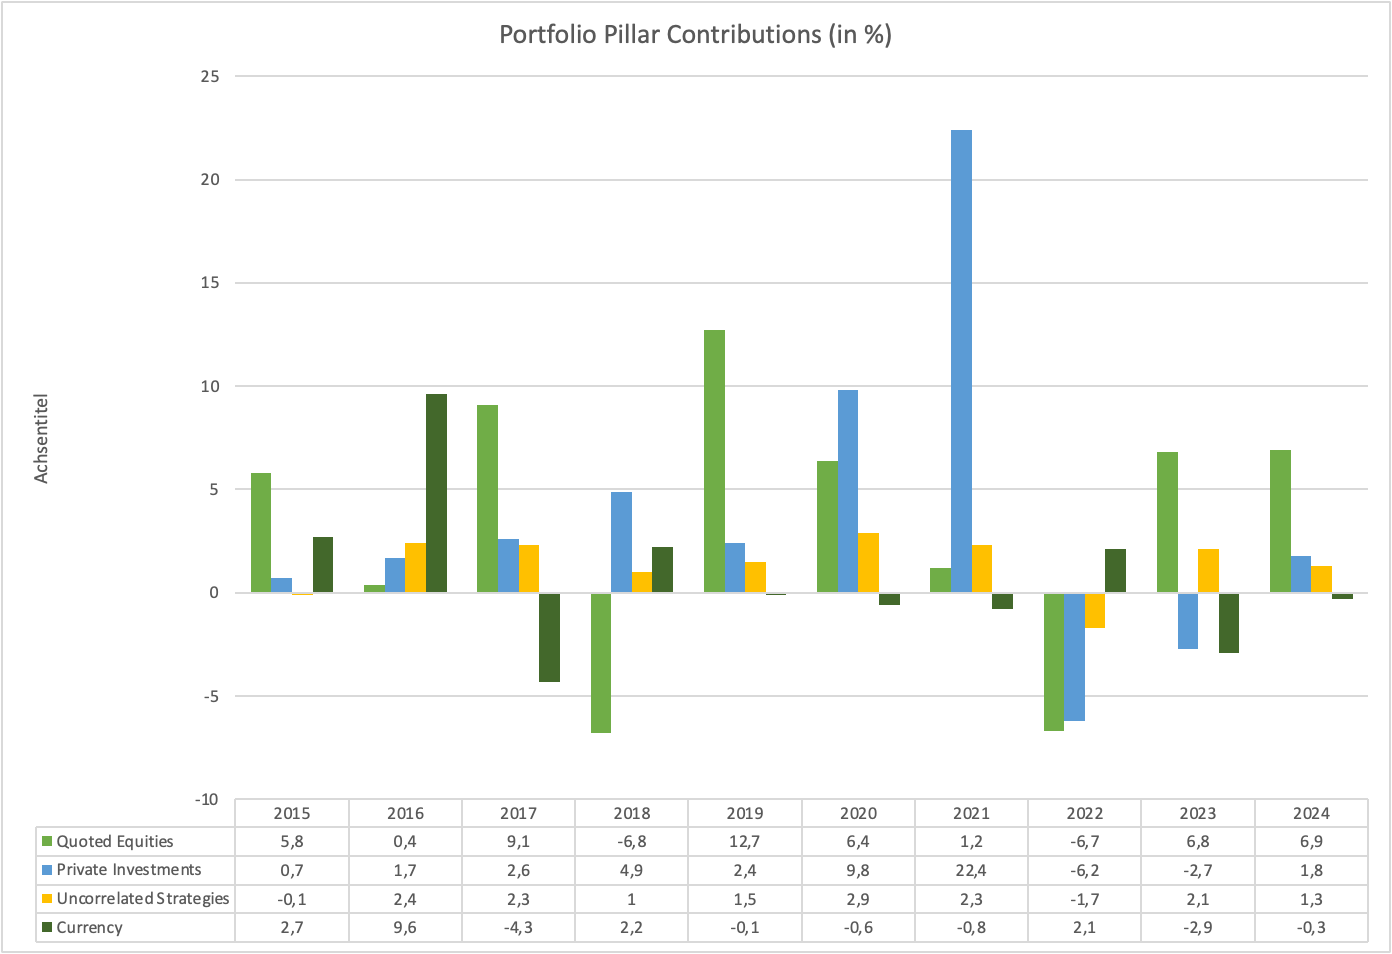
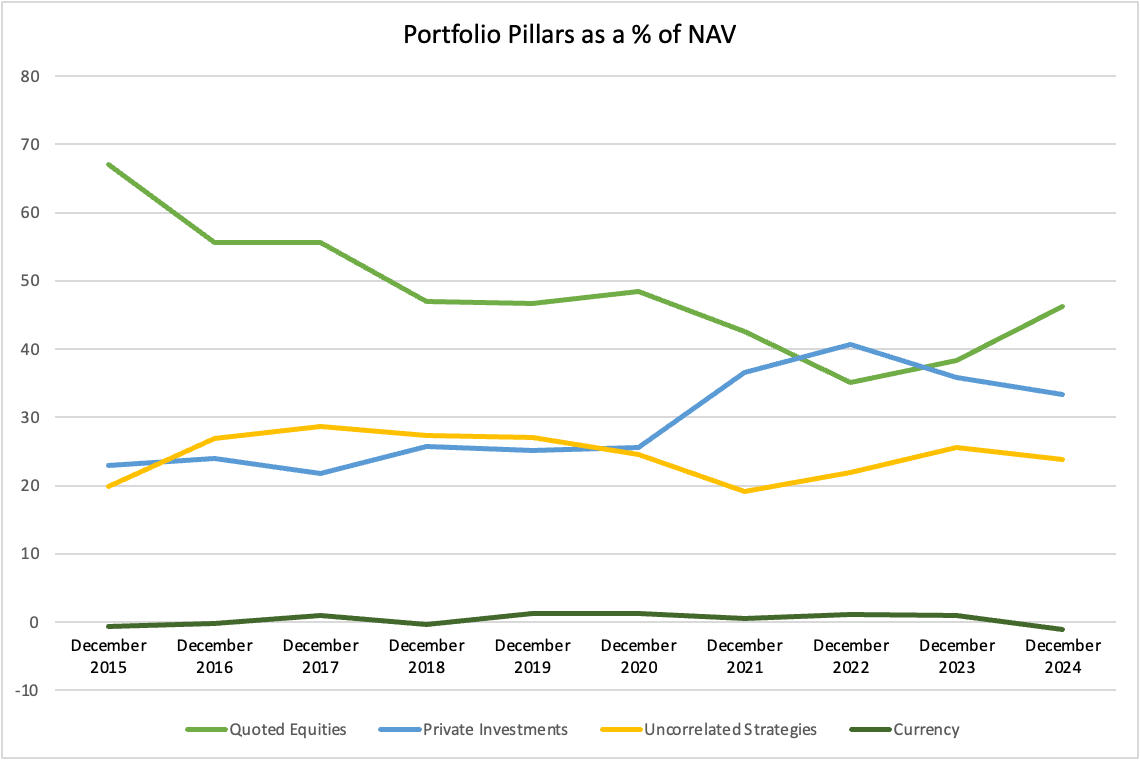
The above chart shows the performance contributions by portfolio pillar since 2015. Example: If you look at 2024 this means that Quoted Equities contributed 6.9 percentage points of performance to the NAV, Private Investments 1.8 %, Uncorrelated Strategies 1.3 % and Currencies -0.3 %, leading to a Total Investment Performance of 9.7% across the whole portfolio (unadjusted for borrowings) for 2024. I produced this chart to look particularly at Uncorrelated Strategies. The RIT management seems to be doing a very good job allocating capital there, because contributions to Total Performance were positive in every year (except 2022), exactly what I want to see in a portfolio containing alternatives.
The chart above shows how stable (or unstable) the allocations in the three pillars were as % of total NAV. After 2020 valuations for Private Investments were definitely over the top, which is reflected in the sudden rise as a % of NAV. These valuations have come down by now, and also RIT management has been reducing exposure to private assets taking advantage of valuations. In the next steps I will examine every pillar one by one to get you through the portfolio.
Pillar I: Quoted Equities
RIT’s quoted equity portfolio is best understood as a collection of high-conviction themes expressed through a mix of direct holdings and specialist managers, rather than a top-down geographic allocation.
The U.S. remains core but capital has increasingly flowed to Europe and Asia, also highlighted in recent interviews with the CEO Maggie Fanari. This reflects a belief that returns are broadening in a more multipolar world.
Rather than relying on broad indices, RIT partners with specialist managers who bring deep domain expertise. RIT also holds direct, high-conviction public equities, typically businesses with strong competitive positions, durable cash flows, and long reinvestment runways. As of July 2025 the split in the equities section was roughly 50/50 between direct investments and fund managers. The portfolio is centered around certain themes:
China & Asia: specialist managers focusing on domestic champions, platform businesses, and mispriced cyclicals
Quality: companies with high barriers to entry
Japan: exploiting corporate-governance reform, balance-sheet optimisation, and shareholder-friendly capital allocation
Healthcare & Biotech
SMID: overlooked target segment outside mega-cap consensus trades
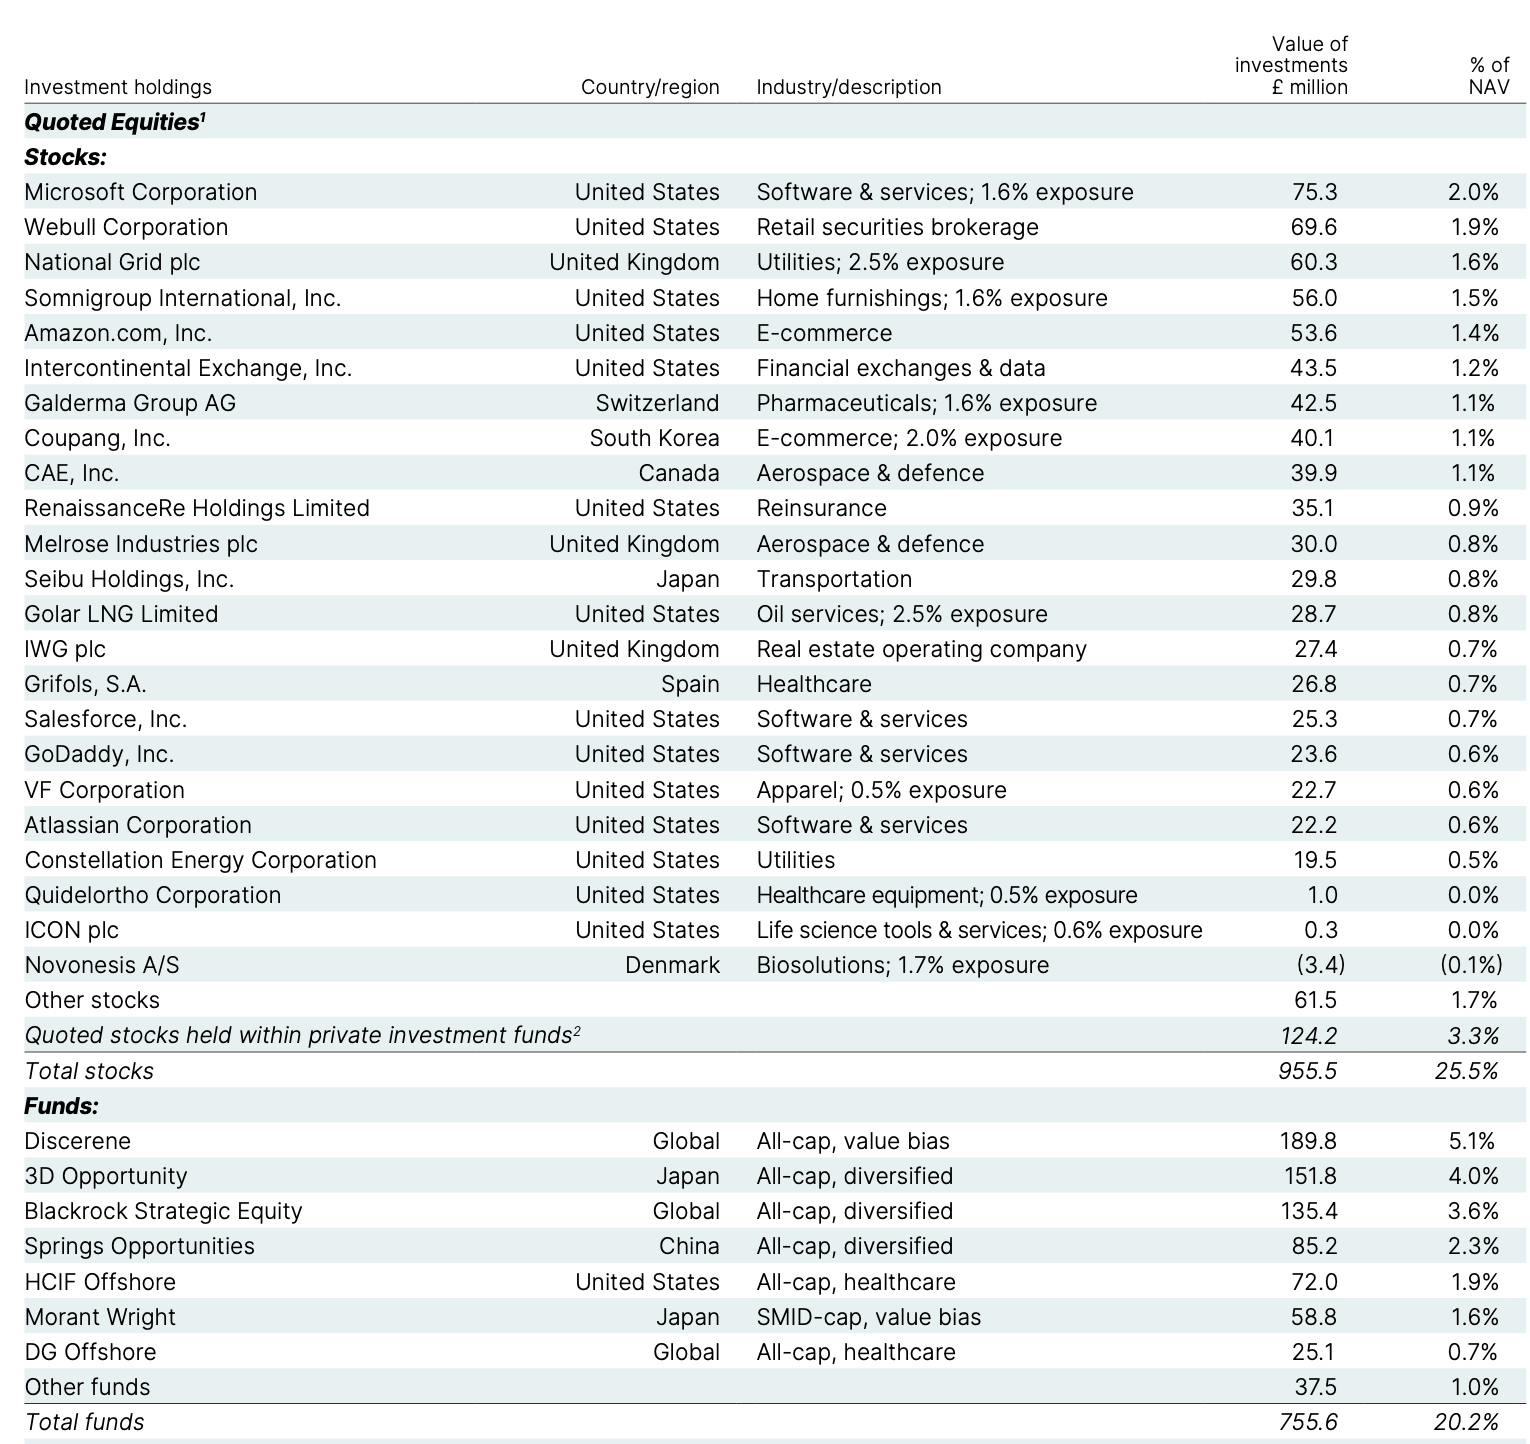
Below you will find an overview of individual stock holdings and also funds:
One question that naturally comes up: what would RIT’s results have looked like if the quoted equity sleeve had simply been a passive global index fund? In some years, especially during periods of U.S. megacap dominance, the answer is probably yes, returns would have looked better on a narrow, ex-post basis.
But that’s not the right test. RIT’s equity book is not built to win every momentum regime. It is built to diversify return sources, avoid single-factor dependence, and interact sensibly with the private and uncorrelated sleeves. Replacing it with a passive index would likely have increased correlation to global equities, amplified drawdowns, and changed the portfolio’s behaviour in precisely the environments where RIT is supposed to earn its keep.
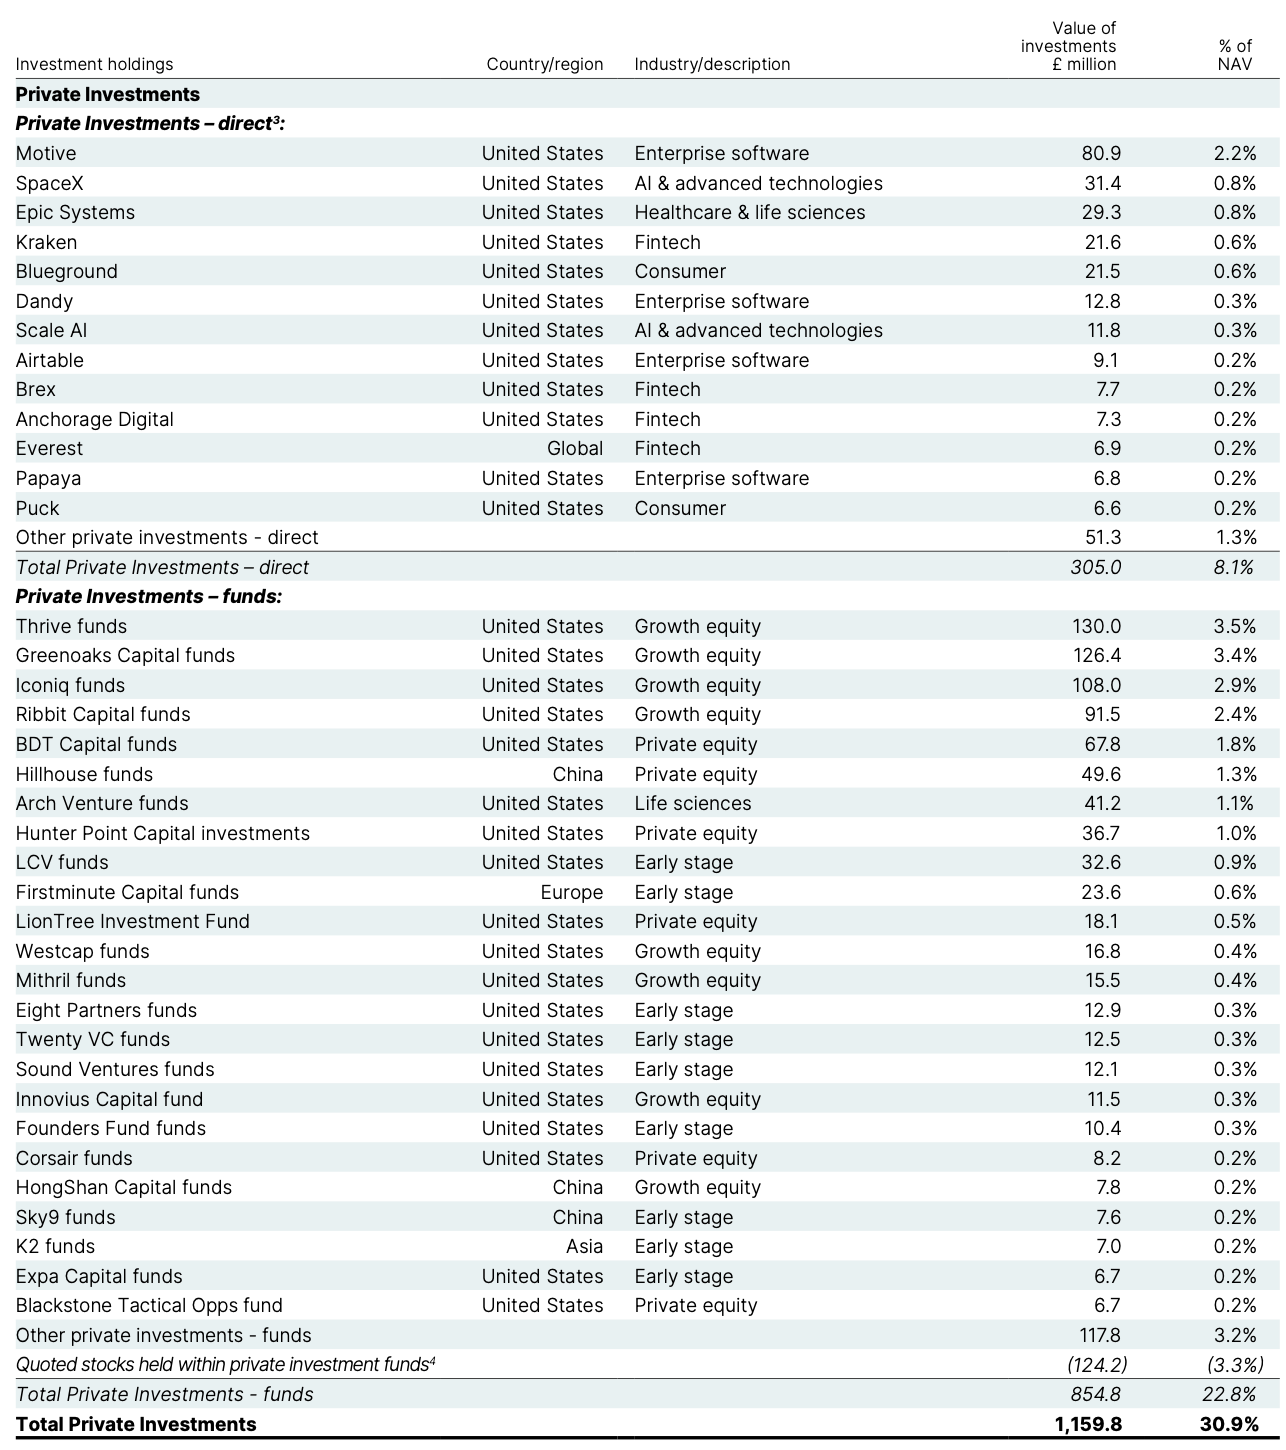
Pillar II: Private Investments
Private investments are the most misunderstood, and (probably) most valuable hidden part of RIT.
They currently represent ~30% of NAV, down from over 40% in 2022 following substantial realizations. The reduction was intentional by management, and they have clearly stated that they will continue to keep the target range of 25 to 30% of NAV.
RIT either invests directly in private deals or partners with a small group of elite managers. These managers are often oversubscribed and selective in whom they allocate capacity to.
Key partners include:
Thrive Capital: known for backing category-defining technology companies such as OpenAI; long-term, founder-aligned
Greenoaks: disciplined growth investor (e.g. Scale AI, Coupang)
Iconiq: late-stage growth with deep access to global tech founders
Ribbit Capital: fintech specialist (Xapo, Stripe, Kraken)
Founders Fund: contrarian technology investing
BDT/MSD: long-duration family capital
These relationships give RIT something rare: both fund exposure and selective co-investment access.
Direct Private Holdings: Examples & Realisations
RIT’s direct private portfolio focuses on category leaders. Management stated they do not intend to make any speculative early-stage bets. A few examples:
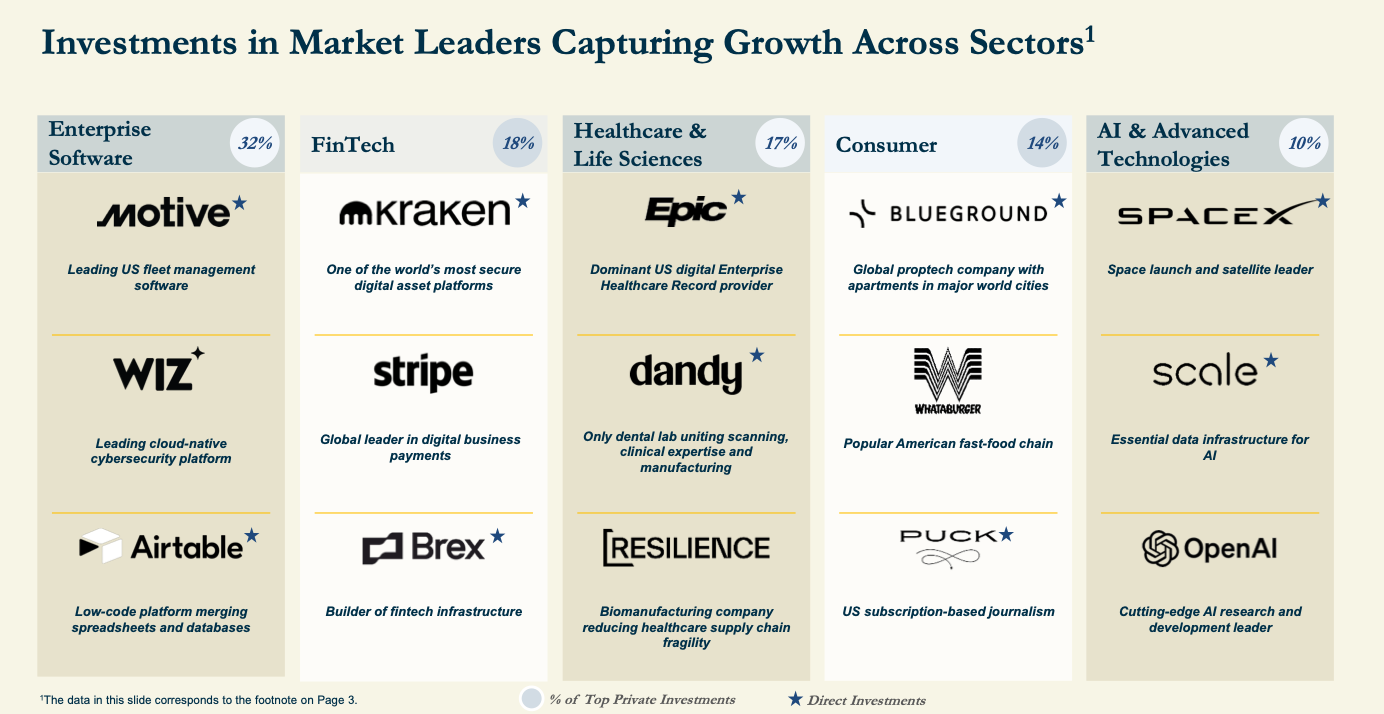
Management has stated that ~99% of direct private holdings are either profitable or have >12 months of cash runway, which materially lowers downside risk (in theory).
“Investments are considered profitable on the basis of either EBITDA, FCF or Net Income.”
This is where accounting definitions deserve skepticism. EBITDA profitability, in particular, can be a very forgiving concept. It is useful for lenders, less so for owners. Charlie Munger would likely have dismissed the footnote in a single sentence.
That said, this statistic is not central to the investment case. What matters far more is the quality of the allocation decisions, the quality of the fund managers.
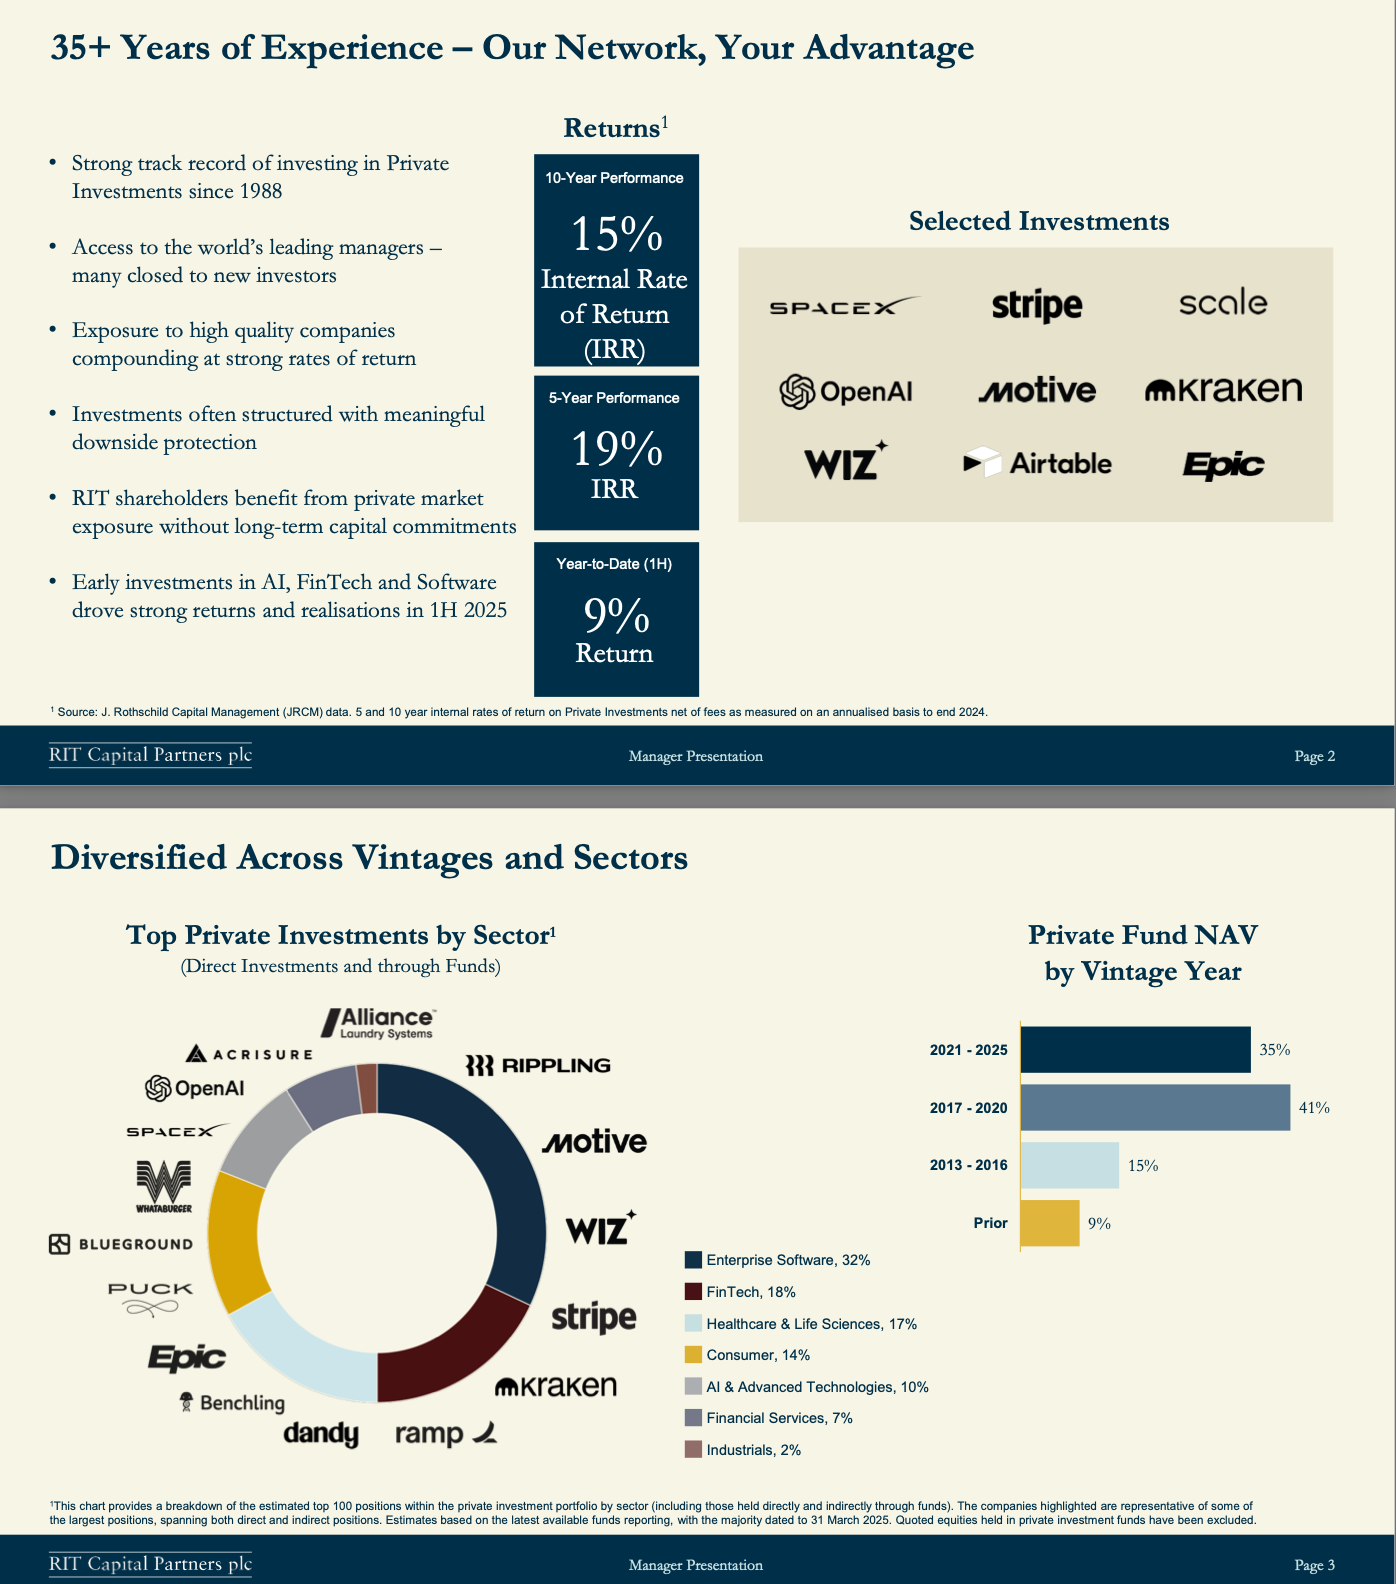
As visible in the chart(s) below, investments are diversified by position sizing, fund sizing and also by sector / industry.
Over the last ~18 months, RIT has realized roughly 25% of its private portfolio, including:
£175m of realizations in 1H25 alone
Exits historically averaging ~23% above carrying values
Recent highlighted exits ~100% above carrying values
There is no guarantee that the remaining 30% of NAV can only be realized below carrying values.
Personally, I remain cautious towards private equity and valuations in this sector. The recent offering of products to retail investors in this sector is not a great thing, it is a warning sign.
RIT has an experienced management team, and access to the top-notch private equity funds and investments. If I want any exposure to this sector then most likely through these top funds and through RIT. I will avoid anything else. I am aware of the discount the market currently assigns to RIT, and I am certain that this is not totally wrong. However, as you will read later, I highly doubt that a 25% discount is justified.
Pillar III: Uncorrelated Strategies
The uncorrelated sleeve exists for one purpose: allowing RIT to stay invested elsewhere when markets dislocate.
This pillar includes:
Absolute-return hedge funds
Macro and market-neutral strategies
Public credit (explicitly not private credit)
Gold and select real assets
Management has been explicit in recent interviews about avoiding private credit, preferring liquidity and true diversification over yield illusion. I like that approach.
In early 2025 among market volatility due to tariffs, this sleeve delivered mid-single-digit positive returns, exactly as intended, and over time has usually had positive contributions to overall returns.
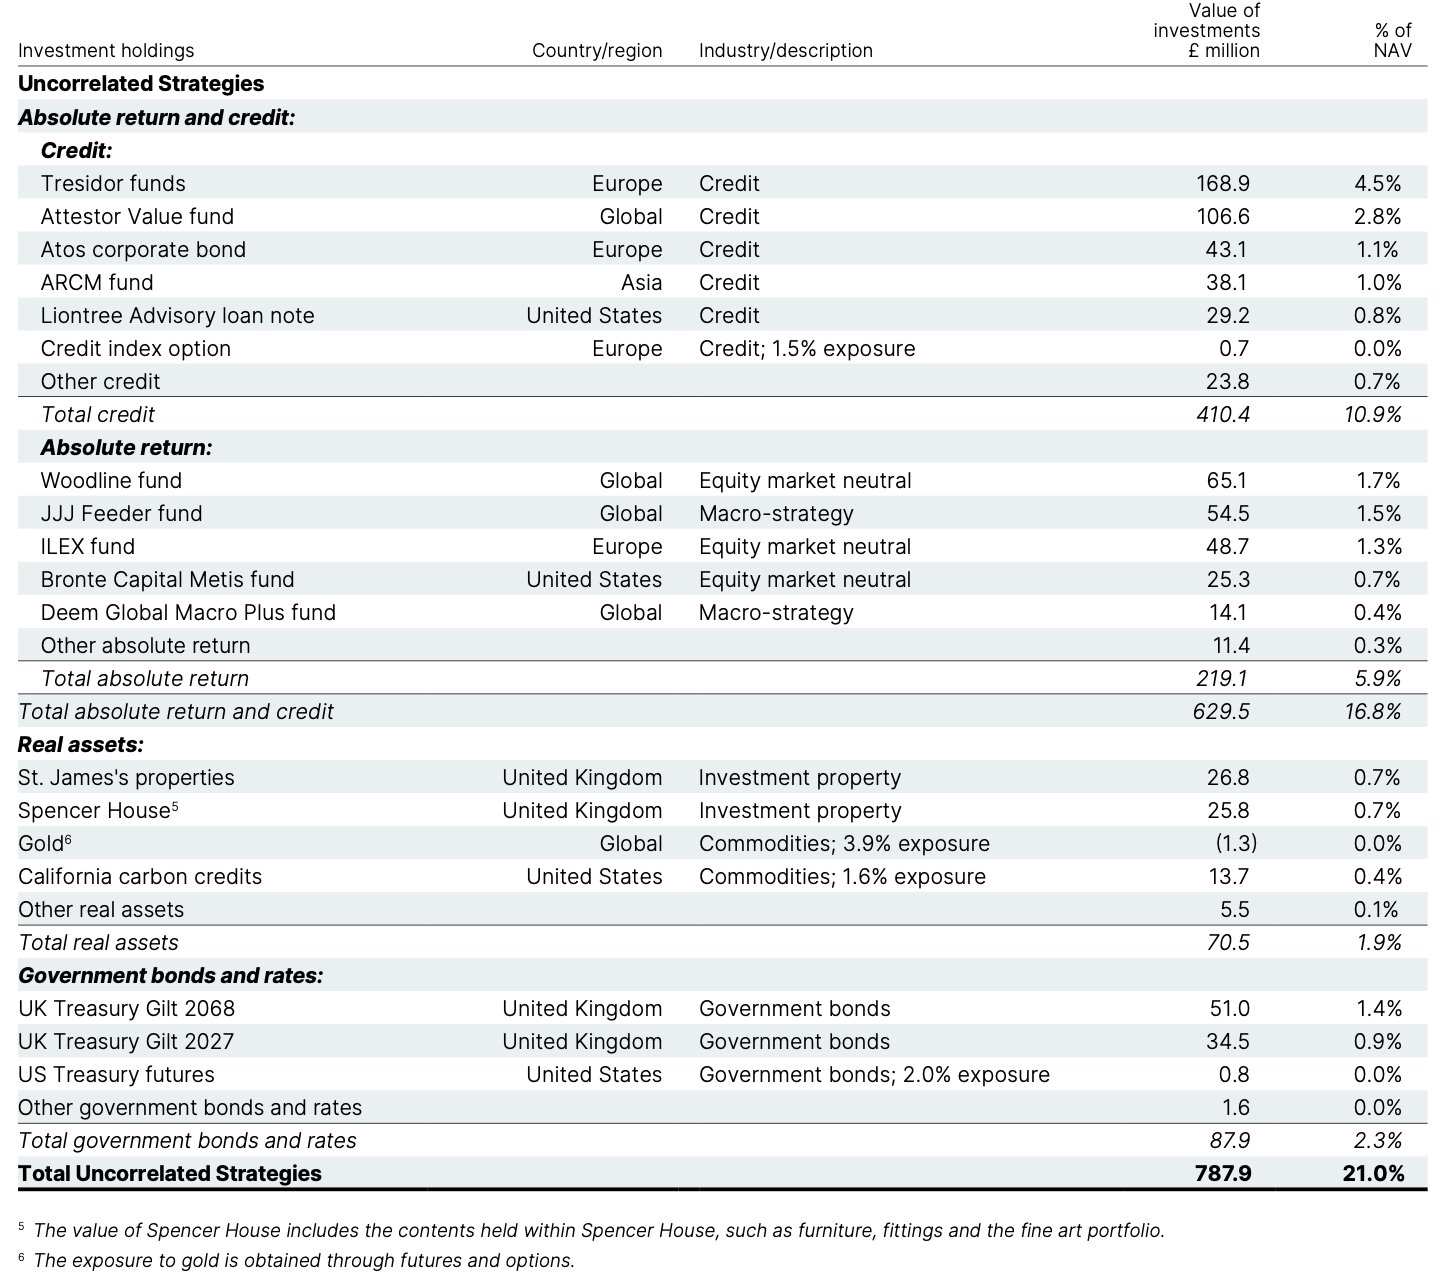
At The Tiny Family Office I also have between 20 and 30% of capital allocated to uncorrelated strategies. My own exposure is a bit lower to credit strategies compared to RIT, but also includes macro, multi-strategy, and equity market neutral funds, as well as gold.
Management, Incentives, and Alignment
RIT’s governance structure is very aligned for a listed vehicle.
The bonus pool is capped at 0.75% of NAV
In negative years bonuses are obviously lower
High-water marks apply
~60% of variable pay in shares, multi-year vesting (3 years + 2 year lock-up)
Clawback and malus provisions
The Rothschild family owns >20% of the trust, anchoring the shareholder base with permanent capital. I like this very much, it gives me a better feeling as an investor that my interests are aligned with other large shareholders.
The CEO: Maggie Fanari
Maggie Fanari spent nearly two decades at Ontario Teachers’ Pension Plan. She invested across public markets, venture, growth equity, and private assets globally and ran a high-conviction public equity portfolio. I do not expect RIT to suddenly employ a super successful concentrated investment strategy in equities such as TCI under Chris Hohn, but I believe that Maggie Fanari will certainly allocate capital across the various portfolio pillars in a prudent and rational way to ensure the investment goals are met.
Under her leadership, RIT has already made rational portfolio realizations in private markets, initiated buybacks (to close the discount to NAV), and increased investor engagement.
The Discount
RIT trades at a ~25–30% discount to NAV. Management has responded rationally with:
~10% of shares retired since 2023 (roughly £300m)
YTD approximately £75.6m of shares adding an estimated accretion benefit of +76bps of NAV
The discount does not need to close for RIT to work. It merely provides upside optionality. Historically RIT even traded at a premium to NAV. Worth to keep in mind: During the time it traded at a premium (from 2015 to 2019) private assets were roughly 25% of NAV. I think management will reduce today’s numbers back to 25% again. The question is: Will that change anything in the discount? I do not know.
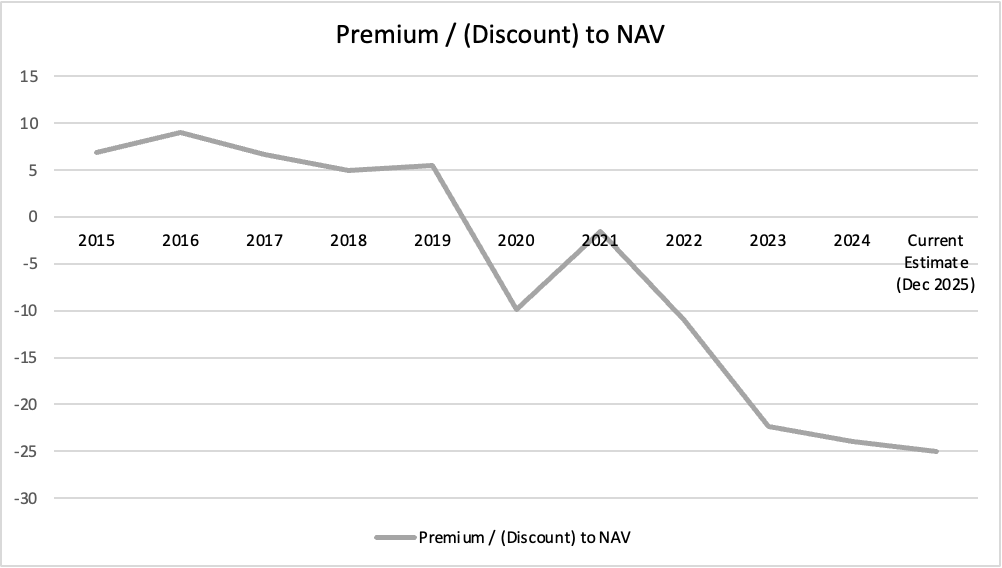
If realizations continue to work, however, the discount should close at some point or at least get closer to 0 than it is now.
Investment Thesis
At current prices, and assuming a 2% dividend is paid each year and reinvested I calculated some scenarios based on a ten year investment horizon:
4% NAV growth, discount unchanged → ~6% IRR
4% NAV growth, discount narrows to 10% within 10 years→ ~8% IRR
7% NAV growth, discount narrows to 15% → ~10–11% IRR
The issue with investment trusts is always that there is absolutely no guarantee that the discounts will close at some point.
Another prominent example: Exor NV. It is the holding company of the Agnelli family with many public investments in companies like Ferrari or Philips. The discount is closer to 50%, and management has also been addressing this issue by selling off (an in my opinion) overvalued holding like Ferrari to buy back shares. RIT Capital, however, is materially more diversified than Exor, so I would not want to compare these two directly.
RIT Capital Partners is not a free lunch, and I do not want to treat the current discount as something that must close. Besides the fact that the discount may continue to persists there are more risks.
Private asset returns may normalize. If exit multiples compress, IPO windows close intermittently, and realizations slow.
Markets could remain narrowly concentrated. If equity returns continue to be driven by a small group of large U.S. technology companies, RIT’s diversified, global, manager-driven approach may lag simple beta for extended periods.
The correct way to think about RIT is not as a “discount-closing trade”. At the current valuation I basically get the private investment portfolio for free while the equity and absolute return section should provide satisfactory returns alone over the next years to come. If the discount narrows, returns accelerate. If it does not, I will still earn NAV growth driven by disciplined capital allocation, private realizations, and crisis resilience.
Summary
RIT Capital Partners is for investors seeking durable compounding, access, and resilience, run by people who think in decades.
Looking at investor outcomes since 2010, RIT’s performance appears underwhelming, particularly for non-GBP investors. From a EUR perspective, total returns compounded at roughly 5.41% p.a. over the last 15 years. This is based on the share price (not NAV). A passive global equity index would have performed materially better over this period.
This underperformance reflects a decade dominated by U.S. megacap equities, a narrowing opportunity set, and limited reward for diversification. RIT’s structure paid a real opportunity cost during this regime. The investment case today therefore does not rest on what worked from 2010–2025, but on whether the next decade will resemble the last decades.
The market currently penalizes RIT for complexity and its exposure to private assets. I do not believe that this is justified in the long run. If it is because private assets are overvalued then the equity market as a whole also will have problems with valuations. Keeping in mind the recent realizations, the capital allocation discipline, aligned executive incentives and the overall long term returns I find the penalty excessive. I currently hold RIT since more than a year at 1.5% of my portfolio, a deliberately cautious allocation. I am comfortable with this position and view it as a long-term holding.
This is not investment advice. Please read the disclaimer.